Many businesses and brands are using different social media platforms, but Facebook stands out as the leader in social media marketing.
Facebook's Insights tool provides valuable information about your posts, ads, campaign tracking, and audience demographics, surpassing what other platforms offer.
Understanding the key performance indicators (KPIs) for Facebook ads is vital for your business's digital growth.
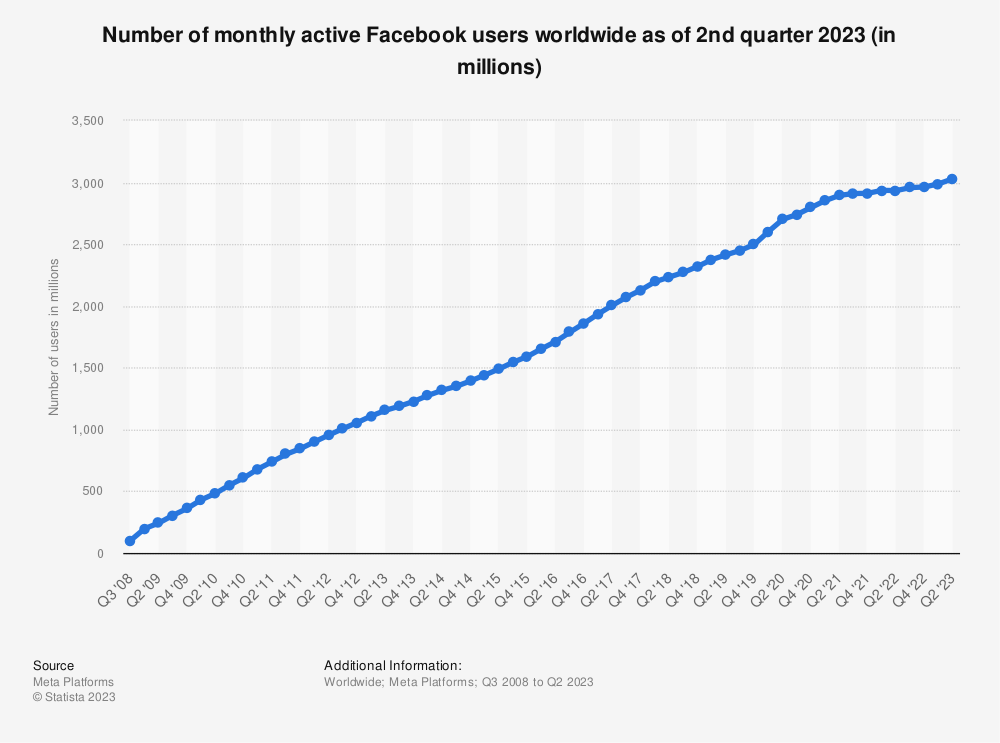
Statista reports that over 2.8 billion people use Facebook every day, and people worldwide spend an average of 2 hours and 24 minutes on social media daily. This means there's a huge audience to reach with your product or service.
With the recent iOS 14 update, it's even more important to closely monitor ad performance.
However, keeping track of all the metrics, especially when managing multiple campaigns for different clients, can be challenging.
That's why having a set of specific KPIs for Facebook ads is crucial.
It gives you a clear view of the data you need to improve your content, understand market demand, and make smart ad investments.
In today's digital world, measuring everything is essential, but it's not always easy. Determining the success of your campaigns and knowing which Facebook KPIs matter most can be confusing.
This blog post is here to help you grasp the key Facebook ad KPIs that truly count and are worth keeping an eye on.
These metrics are vital for evaluating your campaign's performance and succeeding in the digital era.
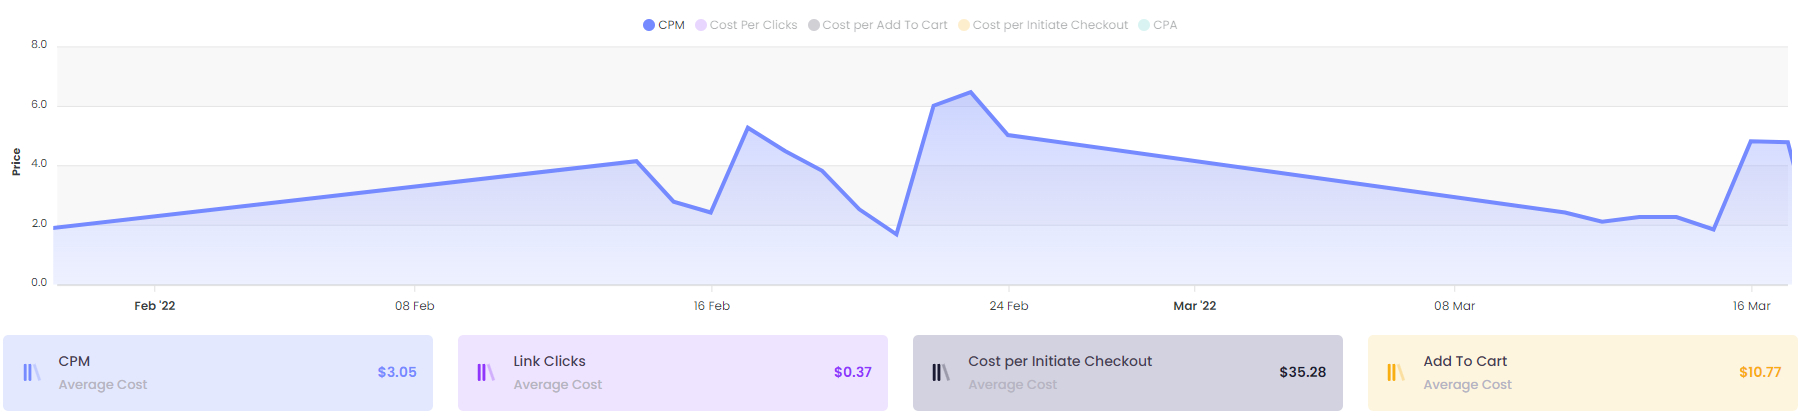
The Cost Per 1000 Impressions KPI
The Cost Per 1000 Impressions KPI, also known as CPM, shows how much money advertisers spend to show their ads to people. This Facebook metric helps assess how well an ad campaign works. To calculate CPM, you divide the total cost by the number of times the ad was seen.
To calculate CPM, you divide the total cost by the number of times the ad was seen.
Cost-Per-Impression (CPM) = total cost/number of impressions generated
Don't just see impressions as a measure of visibility. It actually give you useful insights into your advertising.
If you have a high impression rate, it means lots of others are also trying to get attention.
A low impression rate means you're not reaching many potential customers.
Understanding CPM helps you improve your advertising strategies.
The Cost Per Click (CPC)
The Cost-Per-Click, also known as CPC or PPC, represents the money spend when someone interacts with your advertisement by clicking on it.
The standard formula for calculating the cost per click is as follows:
Cost-Per-Click (CPC) = total cost ÷ number of clicks generated
While this may appear to be a straightforward approach for assessing the efficiency of your campaign, it can be misleading.
For example, a higher click rate might imply that the ad is extremely popular, with individuals clicking on it hastily in the hope of finding something better.
Conversely, a lower cost-per-click could also indicate that your target audience is not particularly engaged and is not engaging with your ad.
Therefore, it's crucial to utilize this Facebook ad Key Performance Indicator (KPI) to obtain a comprehensive understanding of how well your campaign has performed thus far.
The Cost Per Lead (CPA/CPL)
Cost-per-lead, also known as CPA or CPL, is the amount you pay when someone fills out your contact form on your website to receive more information.
Formula for calculating for cost per lead is:
Cost Per Lead (CPL/CPA) = total cost ÷ number of leads generated
This metric is often used to gauge the effectiveness of an advertisement. For example. if you spent $500 and received two leads from it, your CPL would be $250.
Cost per lead is an important metric because it helps you figure out how much money you're spending on leads and what your return on investment will be.
With CPL, you can see how many leads your ads generate and how much each of those leads costs.
This way, if one ad has a higher cost per lead than another, then that means it might not be as effective at generating conversions for your business.
The ROAS Return On Ad Spend
ROAS is a crucial metric that indicates how effectively your ads have been performing. It calculates the conversion rate of an ad by dividing the total revenue from your campaign with the total Ad Spend.
ROAS = Facebook Revenue ÷ Total Spend
For example, if you're spending $100 per day and generating $2000 in revenue, your ROAS would be 20x ($2000/$100).
The basic idea behind ROAS is to get back more money than what was spent on advertising. ROAS is also one of the most important Facebook KPIs for affiliate sites. The higher this number becomes, the better it means your marketing budget has been well managed and successfully generated a return for your business. This ratio can also help determine which type of advertisement provides of better results.
The Outbound Click Through Rate (CTR)
A click-through rate indicates the number of times people clicked on your advertisements.
CTR = Number of Clicks ÷ Number of Impressions
It’s calculated by dividing the number of clicks generated by the total impressions from an ad campaign.
If, for example, 100 people out of 1000 saw your advertisement and five clicked it, then CTR would be 10%. The higher this metric becomes, the more likely customers are to interact with what they see in a way that generates ROI for marketers.
This value can also help determine which type or format of ads work best for generating traffic, such as text versus video ads. For instance, videos might attract more attention than other formats because they demand viewers’ focus; however, these same videos may not generate more clicks/leads.
The Cost Per Purchase (CPP)
This KPI for Facebook ad campaign calculates the cost of purchase on Facebook. You calculate this by dividing your total marketing spend by the number of purchases you’ve made to get an average CPP.
For example, if you spent $100 and made six purchases, then your CPP would be $16.67 ($100/6).
This number can be used to determine which type of ad generates the most conversions for a business. For instance, one advertisement might have a lower click-through rate but higher conversion rates because it conveys its message more effectively than another ad that shows up in people's news feeds.
The Average Order Value
This metric is similar to CPP, but instead of focusing on purchases, it focuses on how much money the average order for a business makes. To calculate this number, divide your total revenue by the total orders made and multiply that value by 100 (to make this easier: Revenue/orders x 100).
For example, if you earned $500 in revenue from 10 orders, your AOV would be $50 ($500/10),
which means that every purchase averages out at about $50 per customer who buys from your store.
A high AOV is crucial to any business because it means that you're making more money off of each order which means that you're able to make more and better products for your customers. Also, keeping up with customer demands will be easier since you won't have to worry as much about the number of orders you receive.
The Conversion Rate (CR)
Conversion Rate (CR) measures the number of website visitors who complete a purchase, providing insights into your ad's efficiency. Analyzing CR enables you to gauge the full potential of your converting traffic.
CR = Unique Purchasers ÷ Total Unique Site Visitors
Enhancing your CR can lead to increased sales without additional traffic.
If your CR is below par, it's time to explore strategies such as streamlining the checkout process, refreshing your social media ad creatives, and conducting thorough A/B testing on your offers.